Analytics
Real-time player, retention and connection analytics on every network — built into Infinity-Filter, no extra plugin needed.
Infinity-Filter ships with deep, real-time analytics built into every network. Player counts, retention cohorts, traffic breakdown by ASN/country, RTT latency, blocked vs. allowed connections — all of it surfaced in the panel without any extra plugin to install on your backend.
Where to find it
Open Network → Analytics. The page is split into three tabs:
- Player — who’s connected, where they’re from, what versions they run.
- Retention — cohort analysis, sessions, played time.
- Connection — traffic-level metrics: blocked, allowed, RTT latency.
The tabs cover three very different angles of the same network — pick whichever fits the question you’re answering.
Player
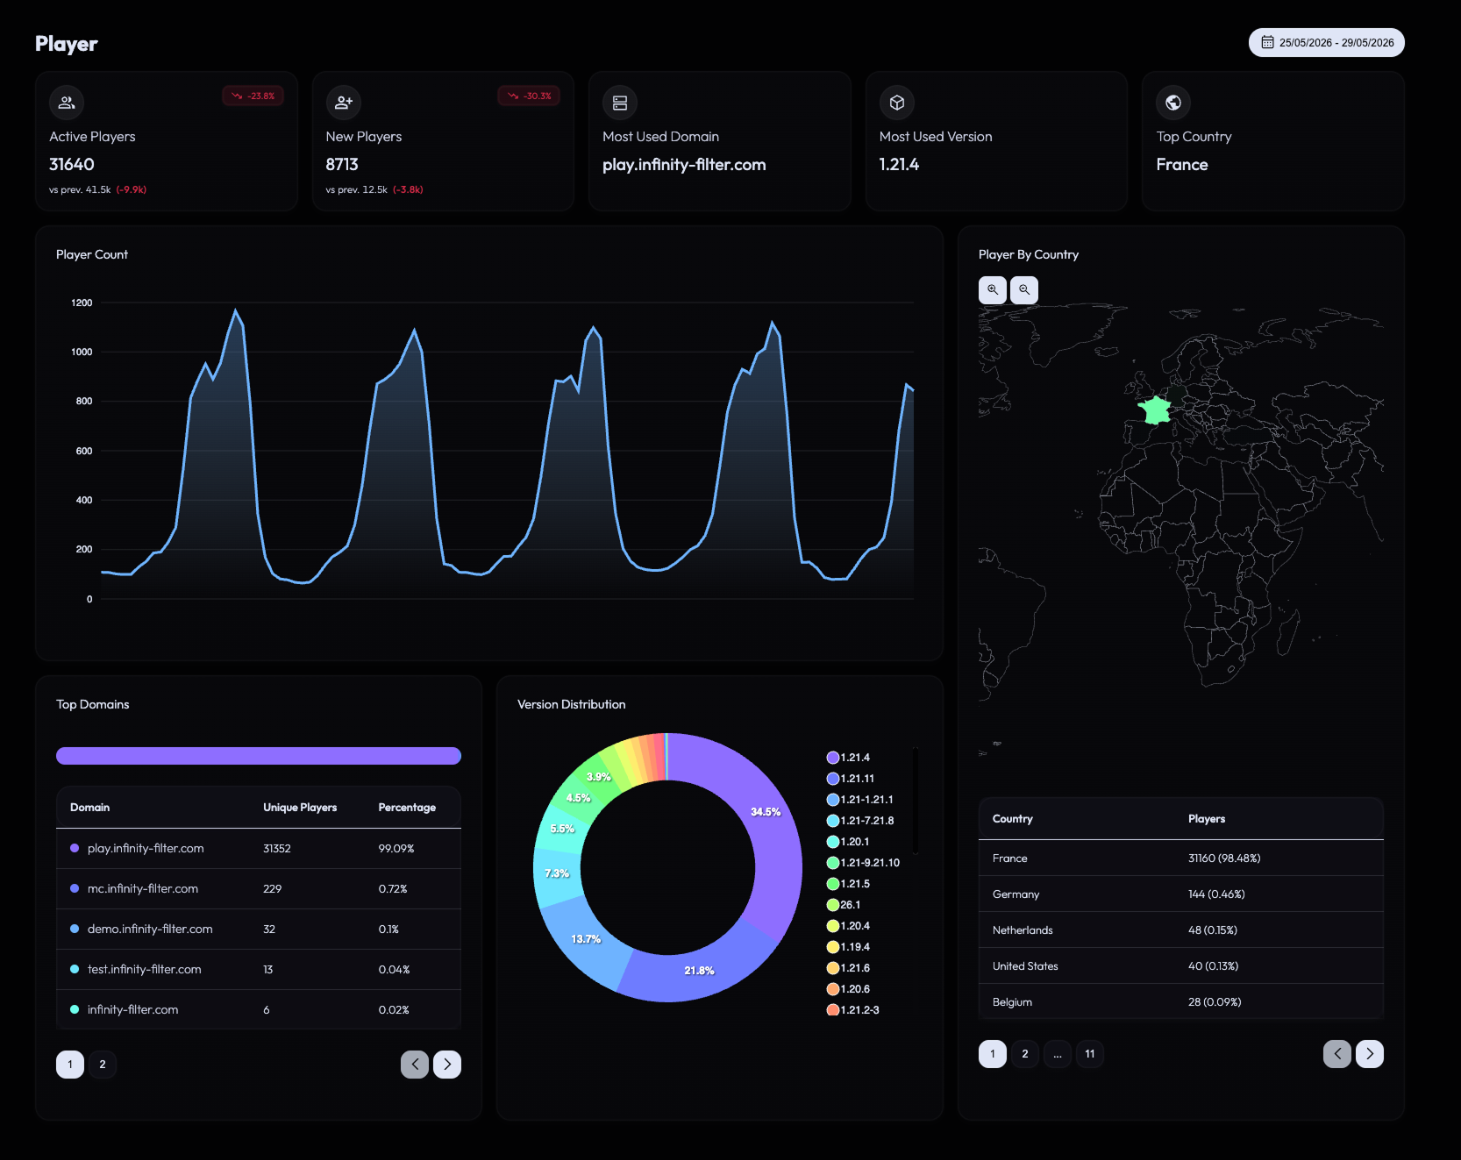
KPI cards
- Active Players — currently online.
- New Players — first-time connections over the selected window.
- Most Used Domain — the hostname most players use to connect.
- Most Used Version — the Minecraft version with the most players.
- Top Country — where most of your audience comes from.
Charts
- Player Count — concurrent players over time.
- Player By Country — interactive world map of where players connect from.
- Top Domains — table of every hostname pointed at the network with its unique-player count and share.
- Version Distribution — donut chart of Minecraft versions in use.
- Country table — full breakdown of players per country.
Use this tab to answer “who plays on my server, on which version, from where”.
Retention
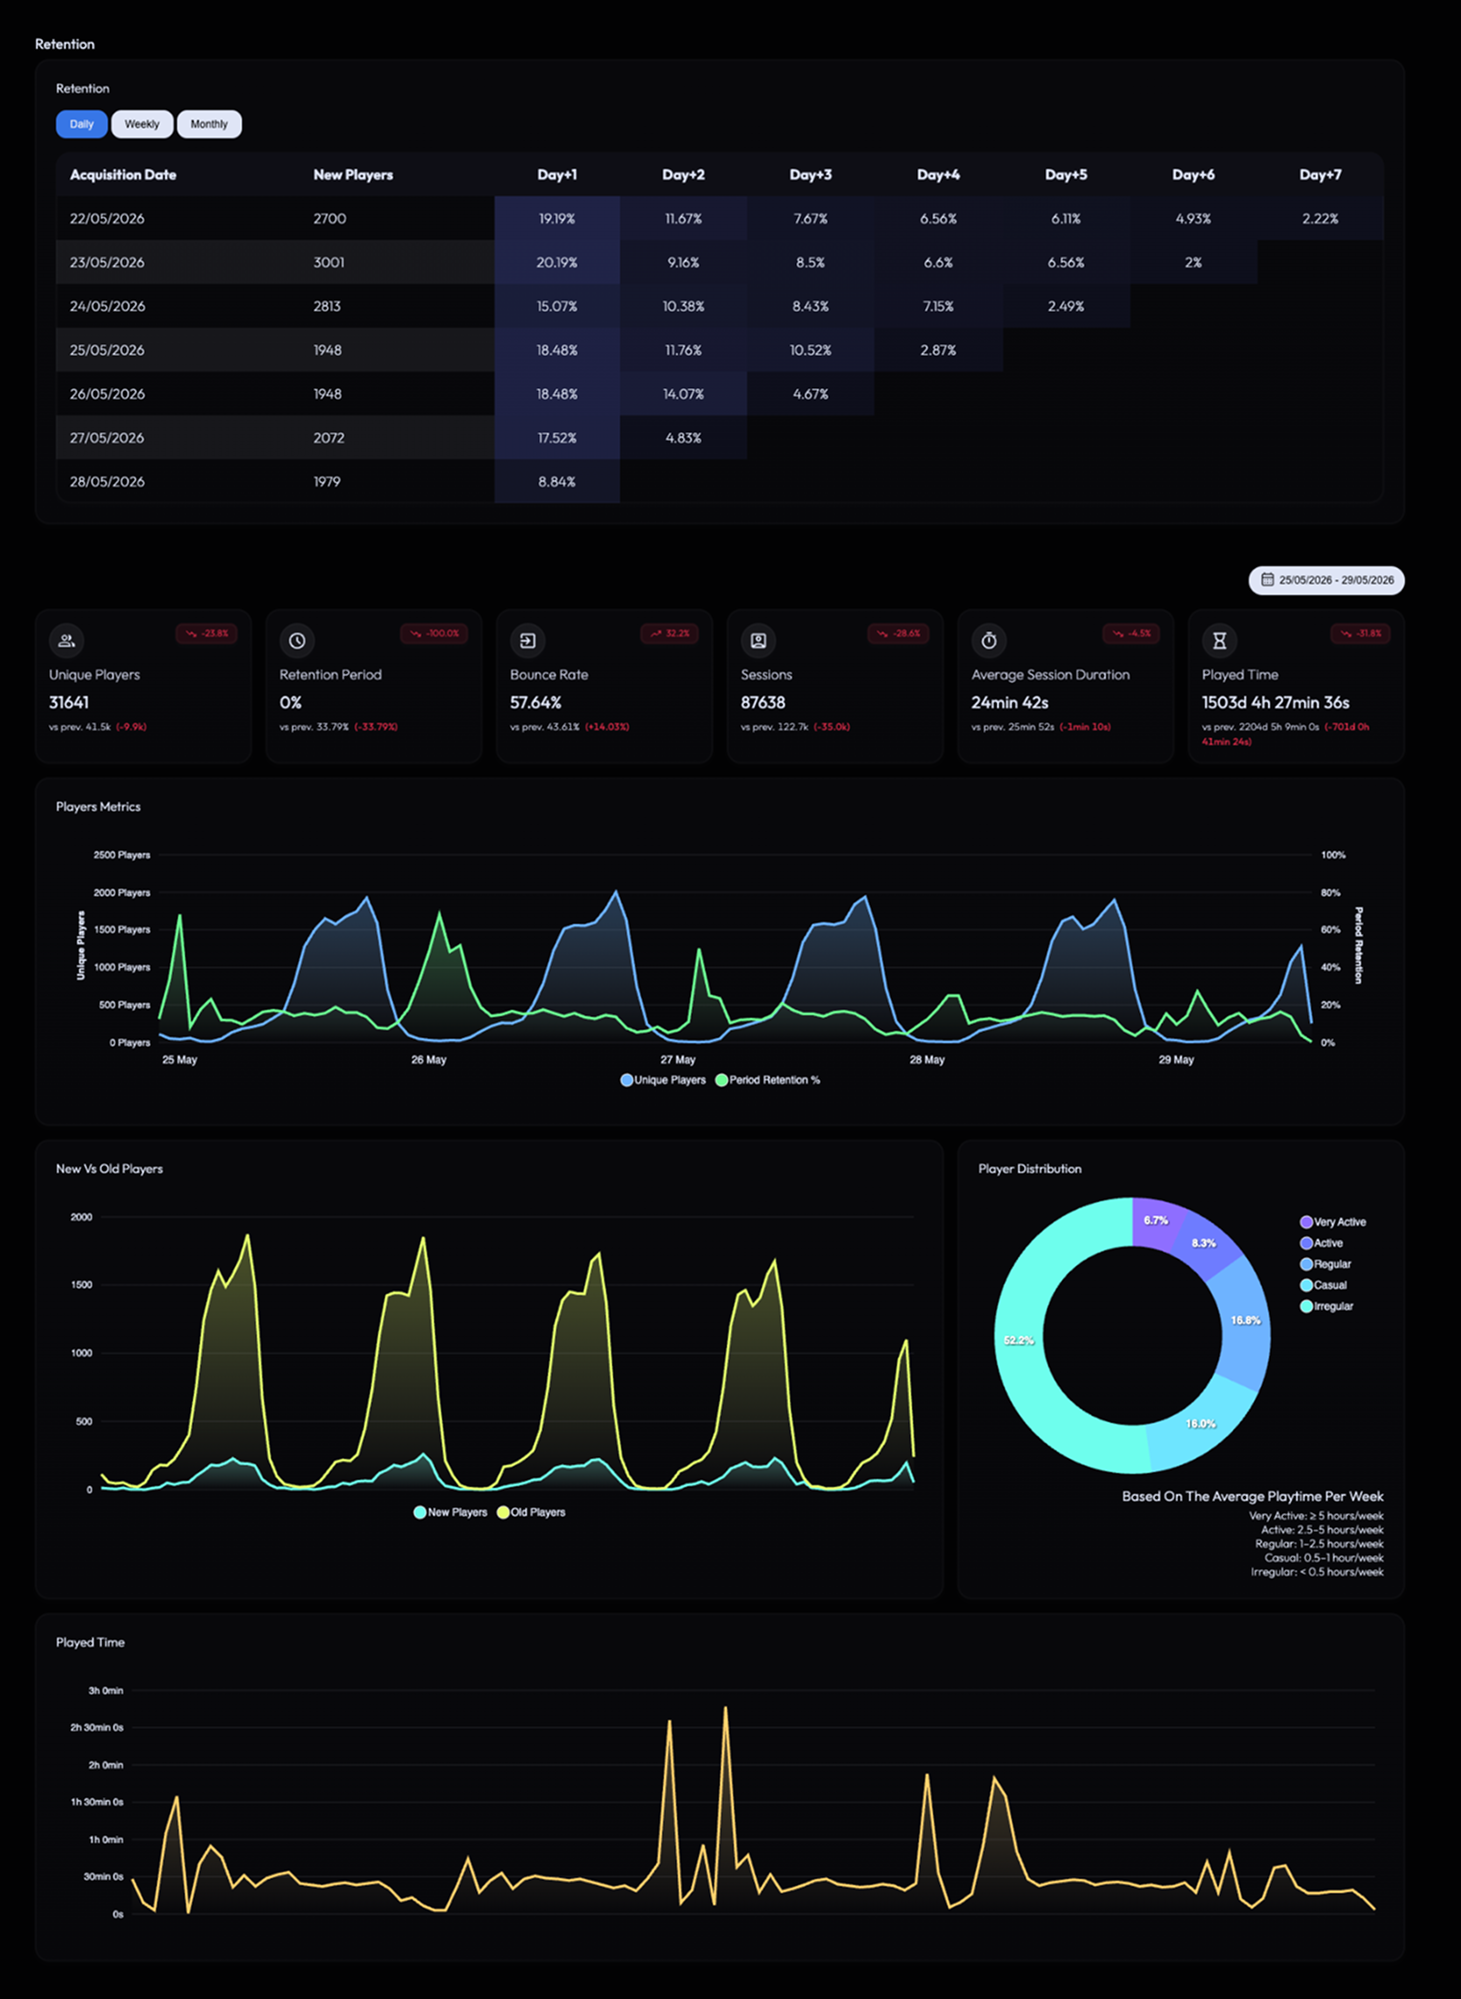
Cohort table
Acquisition-date × Day-N table showing what percentage of new players from a given day were still active 1 / 2 / 3 / … / 7 days later. The colour intensity scales with the retention rate — at-a-glance you see which onboarding days kept their players.
KPI cards
- Unique Players
- Retention Period — D1 / D7 / D30 averages.
- Bounce Rate — share of players who never came back.
- Sessions — total session count.
- Average Session Duration
- Played Time — cumulative time spent across all players.
Charts
- Players Metrics — unique players + retention % overlaid.
- New vs Old Players — bar chart contrasting acquisition with returning players.
- Player Distribution — donut classifying players as New, Active, Regular or Frequent.
- Played Time — total played time over the window.
Use this tab to answer “is my community growing or churning”.
Connection
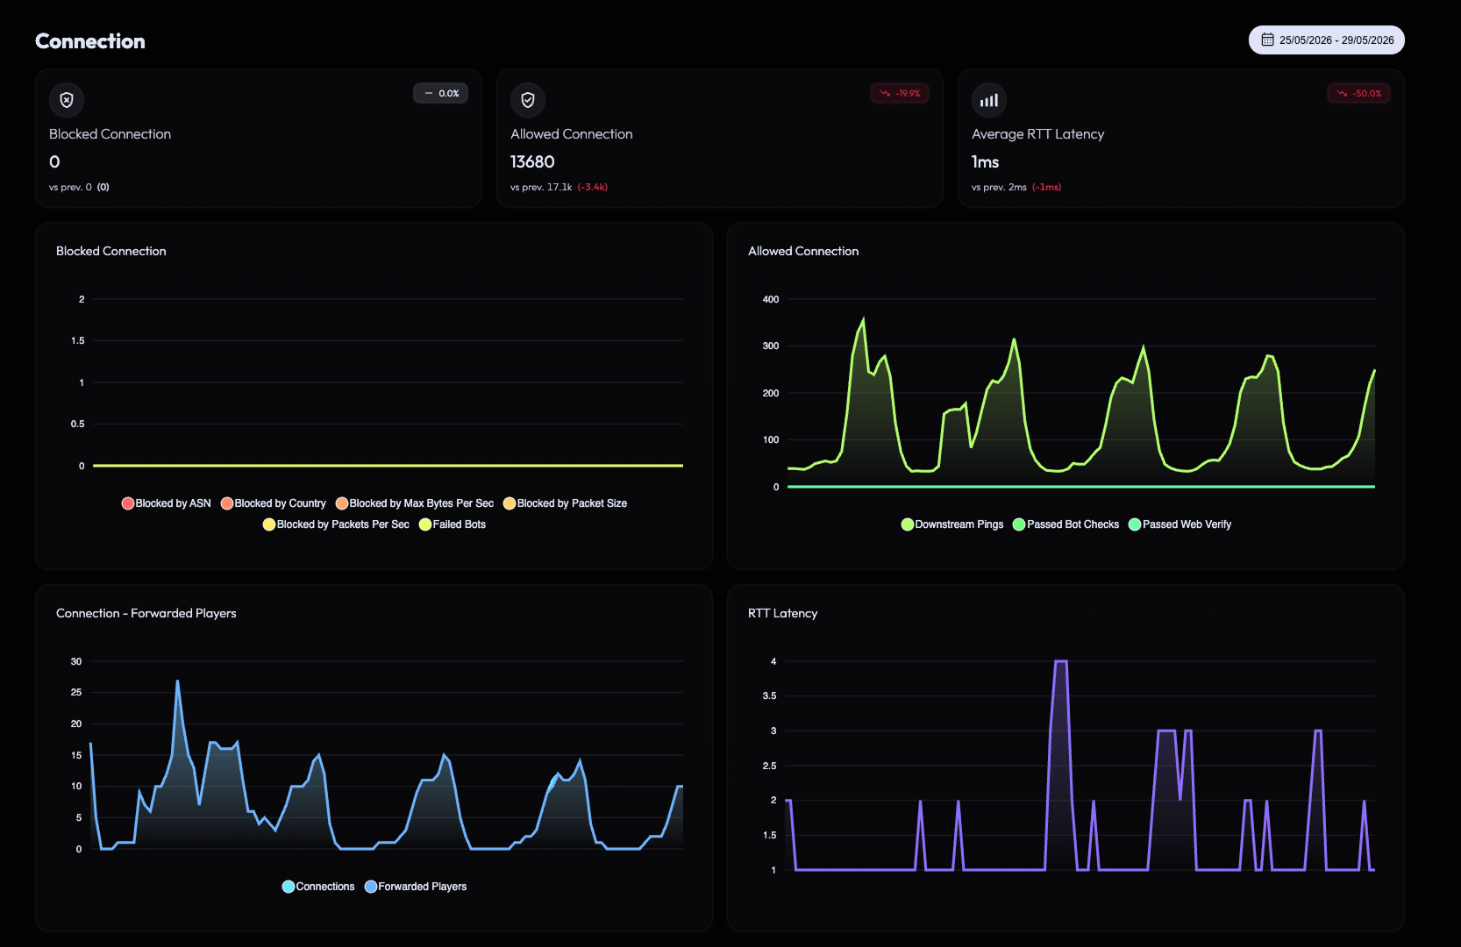
KPI cards
- Blocked Connection — total connections rejected by the edge over the window.
- Allowed Connection — total connections forwarded to your backend.
- Average RTT Latency — typical round-trip time from edge to player.
Charts
- Blocked Connections — breakdown of why connections were rejected: ASN filter, Country filter, allow-rate-per-sec, packets-per-sec, bytes-per-sec, failed bot verify.
- Allowed Connections — breakdown of accepted traffic: connection pings, connections per second, bots that passed verification.
- Connection — Forwarded Players — concurrent forwarded players over time.
- RTT Latency — RTT distribution over time.
Use this tab to answer “what is Infinity-Filter dropping, and what is it forwarding”.
Programmatic access
Every metric on the panel is also exposed via the public API. Use it to feed your own dashboards (Grafana, internal admin panels, …).
What’s next
Last updated: May 29, 2026